Logfire
Logfire は、 Pydantic が開発してるオブザーバビリティプラットフォーム。アプリケーションのログ・トレース・メトリクスをまとめて計測して、ダッシュボードで可視化できる。
OpenTelemetry がベースになってて、 FastAPI や Pydantic、 SQLAlchemy など主要なライブラリには自動計測(instrumentation)が用意されてる。 logfire.instrument_fastapi(app) のように 1 行足すだけで、リクエストの処理過程を span として追える。
Python 標準の logging とも連携できるので、既存の ロギング 設定を活かしつつログを Logfire へ送ることもできる。
Free プランでできることを試してみる。
ローカル環境で動かしてみるためのサンプルコード
import logfire
from fastapi import FastAPI

logfire.configure(
    send_to_logfire="if-token-present",
)

app = FastAPI(title="logfire-test")

logfire.instrument_fastapi(app)


@app.get("/hello")
async def hello(name: str):
    logfire.info("handling hello for {name}", name=name)
    return {"message": f"hello {name}"}
logfire.configure()で Logfire を初期化して、logfire.instrument_fastapi(app)で FastAPI アプリに自動計測を仕込む。これだけでエンドポイントへのリクエストが span として記録される。- エンドポイントの中の
logfire.info("handling hello for {name}", name=name)は手動で書くログ。メッセージは{name}のようなプレースホルダを含むテンプレートで、name=nameで渡した値が埋め込まれる。 f-string(f"handling hello for {name}")だと、残るのはhandling hello for aliceという文字列だけ。テンプレート形式なら、値がname = "alice"(キーがname、値がalice)という構造化された属性としても記録される。だからダッシュボードでは「nameがaliceのものだけ」を絞り込めるし、name単位での集計もできる。 -
send_to_logfire="if-token-present"で「トークンがあるときだけ Logfire のクラウドへ送信する」っていう設定で、トークンがない場合は送信をスキップしてローカル動作だけになる。ここでいうトークンは、環境変数LOGFIRE_TOKENか、あとでlogfire projects newを実行すると作られる.logfire/logfire_credentials.json(プロジェクトの書き込みトークン)のこと。ローカルで試す段階ではまだ無い。これがないとローカルだけで動かせない
send_to_logfireのデフォルトはTrueで、この状態だとconfigure()がクラウド送信用のトークン(認証情報)を要求する。ローカルで試したいだけなのに、アカウント登録やログインを求められて先に進めない。"if-token-present"にしておけば、トークンがないとローカルで動作するので、まず手元で動かして出力を確認できる。
ローカルで動かして、 /hello?name=alice にアクセスしてみる。
FastAPI Starting development server 🚀
Searching for package file structure from directories with __init__.py files
Importing from /Users/alice/code/logfire-test
module 🐍 main.py
code Importing the FastAPI app object from the module with the following code:
from main import app
app Using import string: main:app
info Configuration sources:
• Import string: auto-discovery
tip You can configure an entrypoint in pyproject.toml for this app with:
[tool.fastapi]
entrypoint = "main:app"
server Server started at http://127.0.0.1:8000
server Documentation at http://127.0.0.1:8000/docs
tip Running in development mode, for production use: fastapi run
Logs:
INFO Will watch for changes in these directories: ['/Users/alice/code/logfire-test']
INFO Uvicorn running on http://127.0.0.1:8000 (Press CTRL+C to quit)
INFO Started reloader process [24272] using WatchFiles
INFO Started server process [24275]
INFO Waiting for application startup.
INFO Application startup complete.
11:01:50.532 GET /hello ? name='alice'
11:01:50.541 handling hello for alice
INFO 127.0.0.1:61343 - "GET /hello?name=alice HTTP/1.1" 200
http://127.0.0.1:8000/hello?name=alice にアクセスしたときの出力。 Logfire の行が 2 つ出てる。
11:01:50.532 GET /hello ? name='alice'はinstrument_fastapiが自動で作ったリクエストの span。タイムスタンプ・HTTP メソッド・パス・受け取った引数(name='alice')付き。11:01:50.541 handling hello for aliceはコードに書いたlogfire.info(...)の出力。テンプレートの{name}がaliceに埋まってる。
ローカル動作でも Logfire はコンソールにログを書き出してくれる。一番下の INFO ... "GET /hello?name=alice HTTP/1.1" 200 は Uvicorn(Python 標準の logging)のアクセスログ。
Logfire のダッシュボード
ローカルで動くのを確認できたので、次はクラウドに送ってダッシュボードで見てみる。 send_to_logfire="if-token-present" はトークンがあれば送信する設定だったので、あとはトークンを用意すればいい。 CLI で認証してプロジェクトを作ると、そのプロジェクトの書き込みトークンが作られる。
まず認証。
logfire auth を実行するとブラウザが開くので、 Logfire アカウントでログインする。データの保存先リージョン(US / EU)を選んで認証すると、ユーザーの認証情報が ~/.logfire/default.toml に保存される。コンソール出力は下のような感じ。
% uv run logfire auth

Welcome to Logfire! 🔥
Before you can send data to Logfire, we need to authenticate you.

Logfire is available in multiple data regions. Please select one:
1. US (GCP region: us-east4)
2. EU (GCP region: europe-west4)
Selected region [1/2]: 1
Press Enter to open logfire-us.pydantic.dev in your browser...

Please open https://logfire-us.pydantic.dev/auth/device/wgw7J0... in your browser to authenticate if it hasn't already.
Waiting for you to authenticate with Logfire...
Successfully authenticated!

Your Logfire credentials are stored in /Users/alice/.logfire/default.toml
次にプロジェクトを作る。
logfire projects new <project-name> で新しいプロジェクトを作れる。これでカレントディレクトリの .logfire/ にプロジェクトの書き込みトークンが保存されて、ログが Logfire のクラウドに送信されるようになる。コンソール出力は下のような感じ。
% uv run logfire projects new logfire-test
The project will be created in the organization "<my-account>". Continue? [y/n] (y): y
Project created successfully. You will be able to view it at: https://logfire-us.pydantic.dev/<my-account>/logfire-test
この状態でアプリを起動し直して /hello?name=alice を叩くと、今度はローカルのコンソールに出るのと同時にクラウドにも送信される。ダッシュボードの Live 画面を開くと、さっきの span がそのまま届いてる。
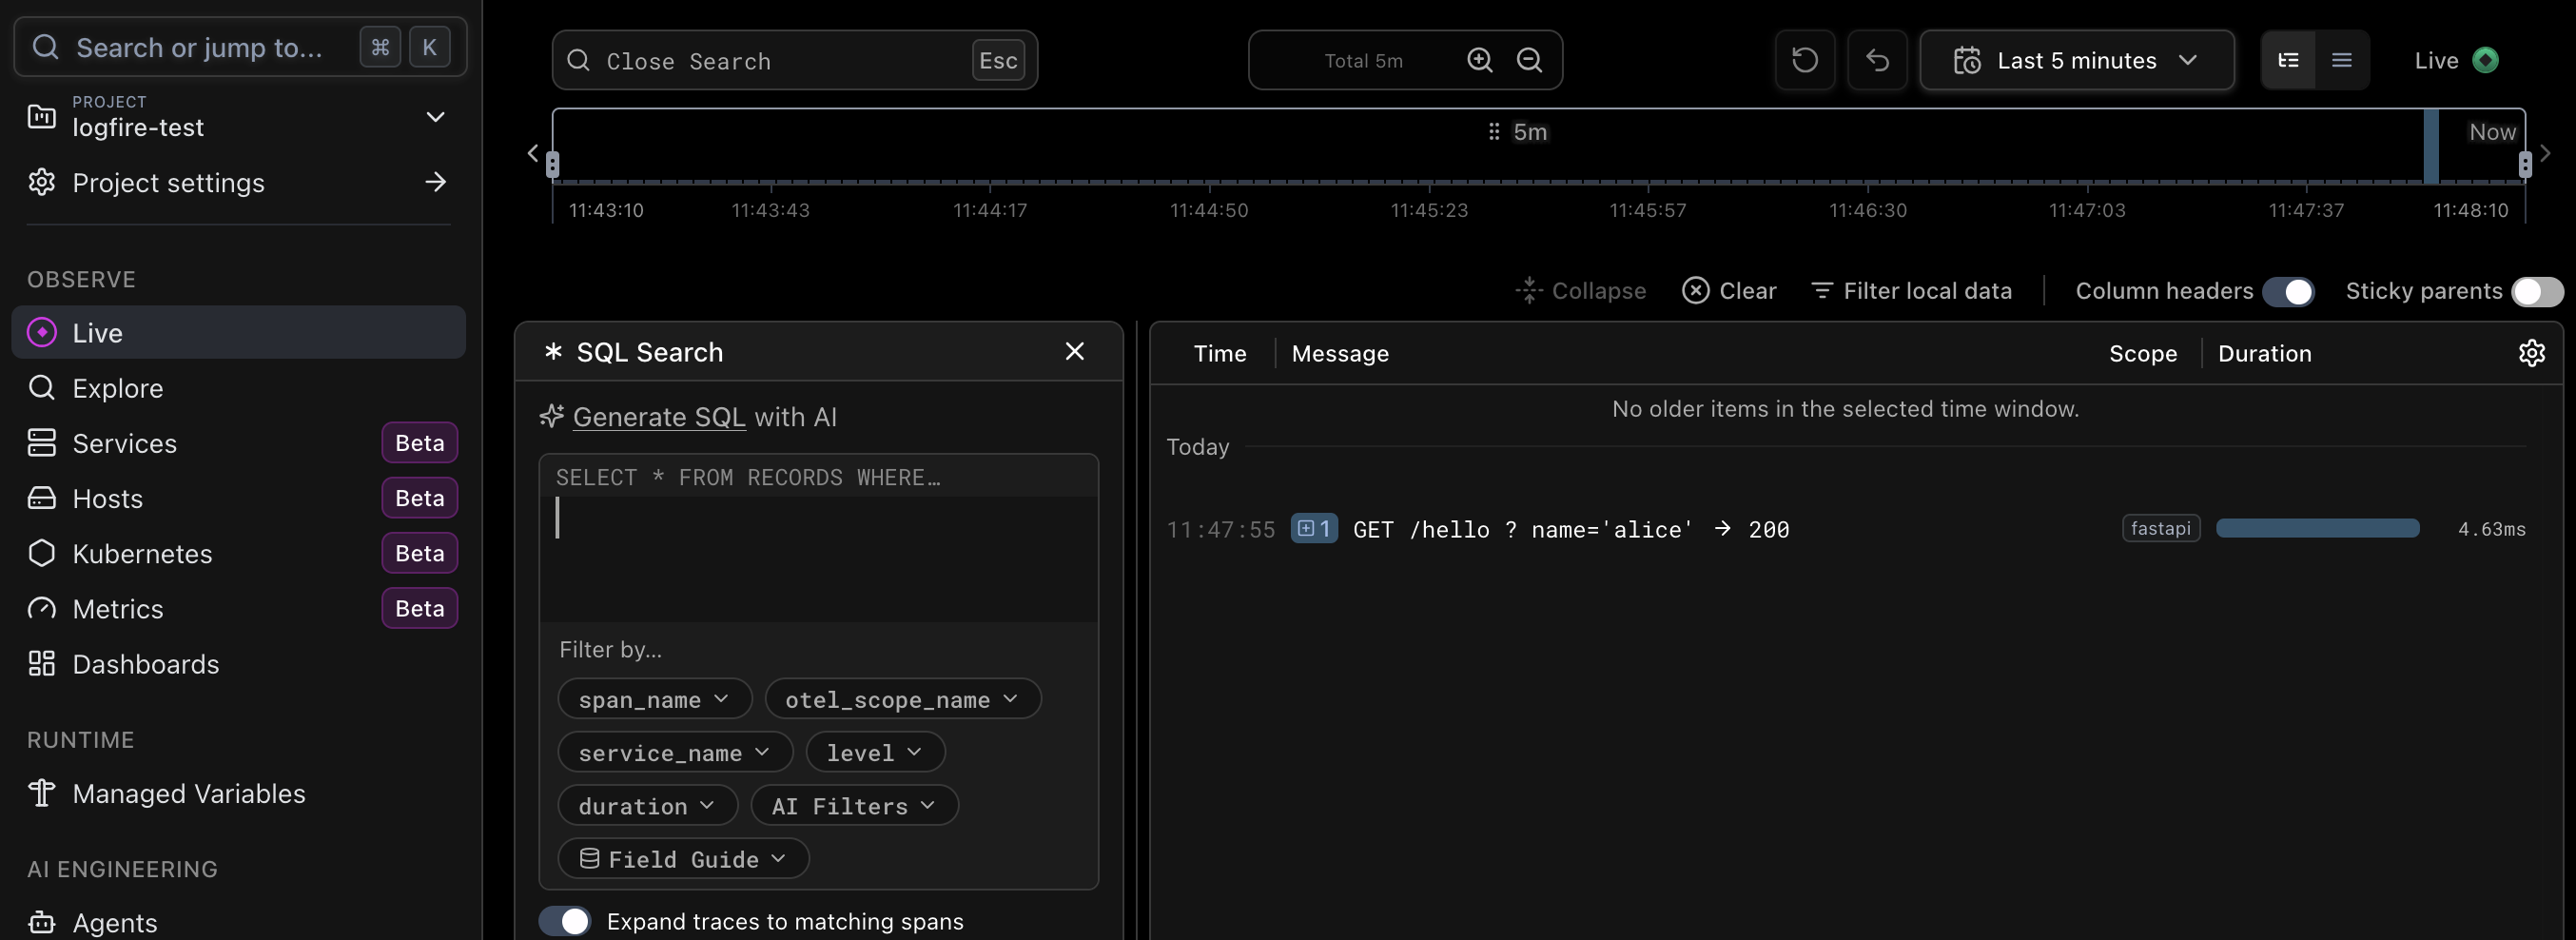
リクエストが 1 件、 11:47:55 GET /hello ? name='alice' → 200 として表示される。 scope は fastapi、 duration は 4.63ms。ローカルのコンソールで見たのと同じ内容が、時系列とレイテンシ付きで並ぶ。
行を展開すると、トレースの親子関係が見える。
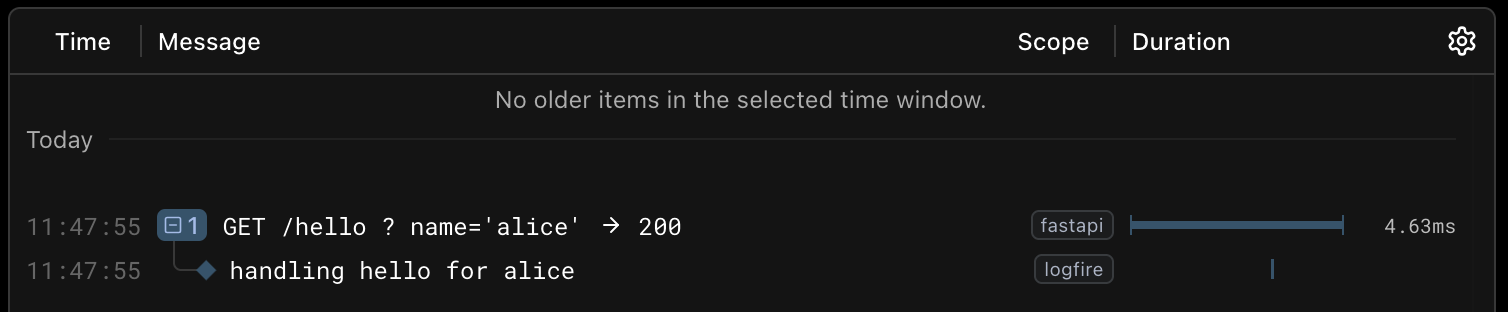
FastAPI が作ったリクエストの span(fastapi)の下に、 handling hello for alice(logfire.info のログ、 scope は logfire)が入れ子で並ぶ。コンソールでは平坦だった 2 行が、ダッシュボードでは 1 つのリクエストにひも付いたウォーターフォールとして見える。
span をクリックすると詳細が開く。
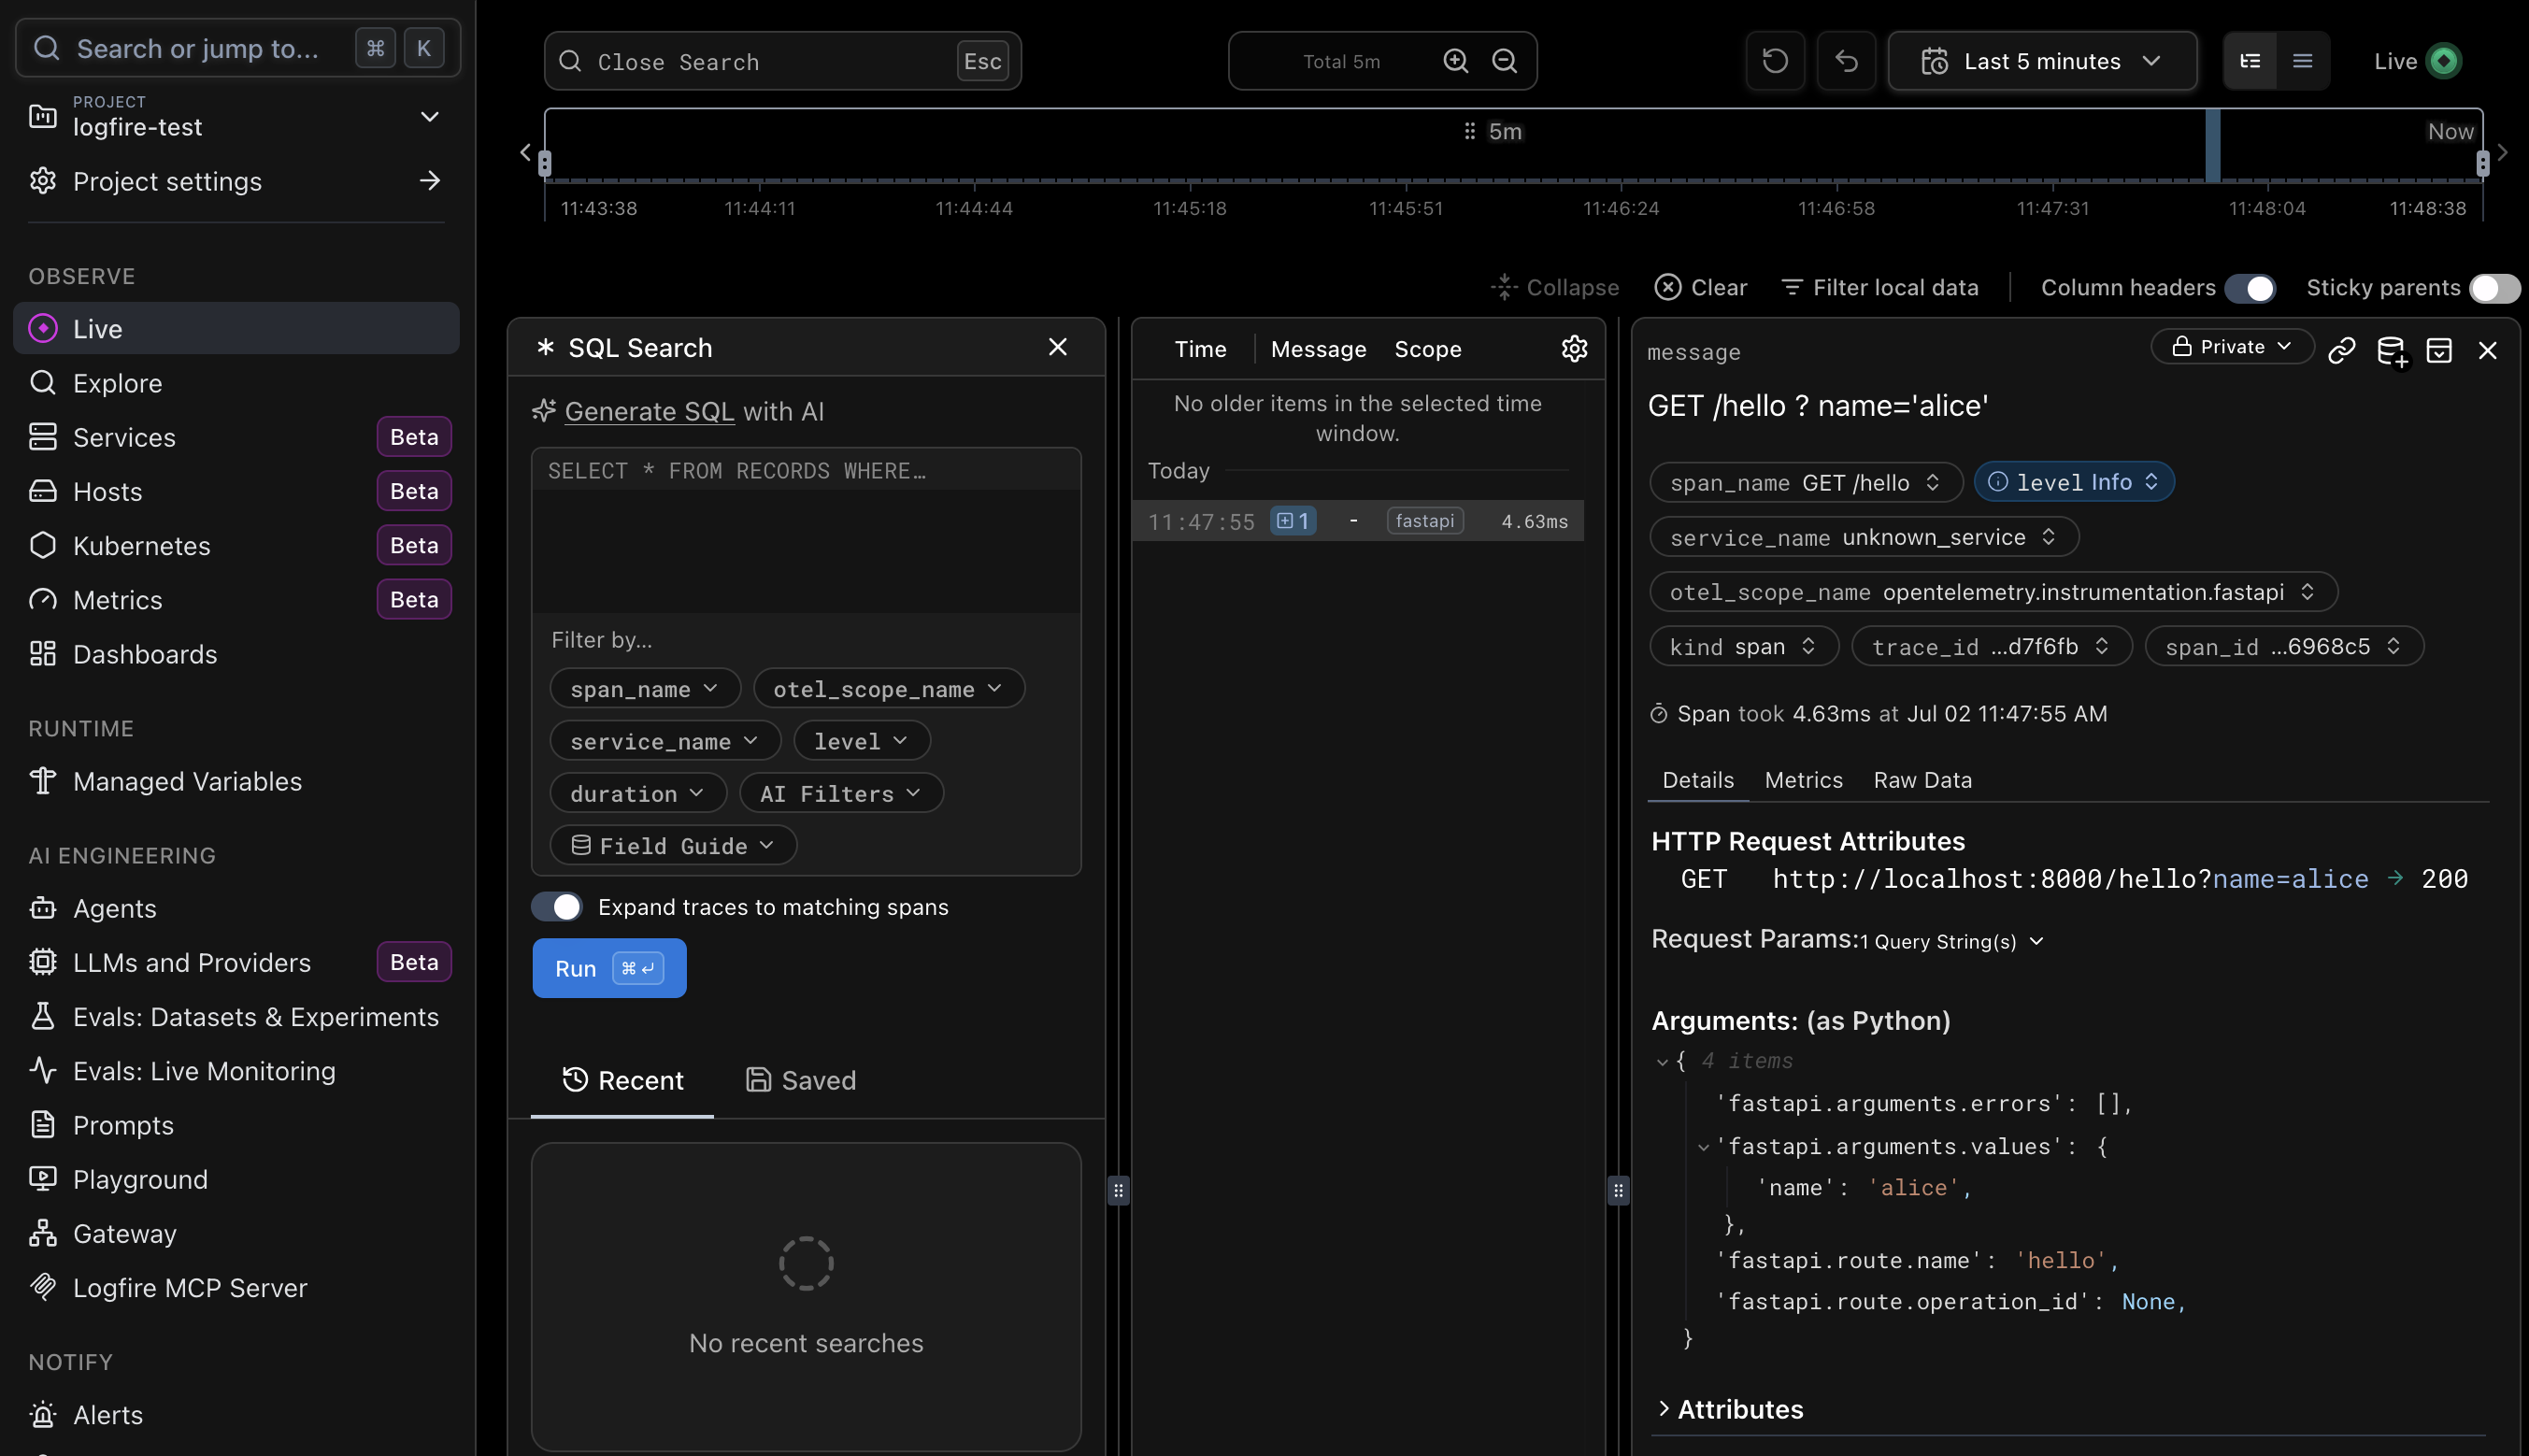
otel_scope_name が opentelemetry.instrumentation.fastapi になってて、これが instrument_fastapi の自動計測で作られた span だとわかる。 HTTP Request Attributes には GET http://localhost:8000/hello?name=alice → 200、 Arguments (as Python) には fastapi.arguments.values: {'name': 'alice'} が入ってる。エンドポイントが受け取った引数まで自動で構造化して記録してるので、あとから name の値で検索・フィルタできる。
もっといろいろ計測してみる
import time

import logfire
from fastapi import FastAPI
from pydantic import BaseModel

logfire.configure(
    service_name="logfire-test",
    send_to_logfire="if-token-present",
)

app = FastAPI(title="logfire-test")

logfire.instrument_fastapi(app)


@app.get("/hello")
async def hello(name: str):
    logfire.info("handling hello for {name}", name=name)
    return {"message": f"hello {name}"}


# Price per item id (stand-in for a database).
PRICES = {1: 300, 2: 1200, 3: 800}


class Order(BaseModel):
    item_id: int
    qty: int = 1


def fetch_price(item_id: int) -> int:
    # Manual span: a child span simulating heavy work such as a DB access.
    # time.sleep fakes some duration so it shows up as a bar in the waterfall.
    with logfire.span("fetch price for item {item_id}", item_id=item_id):
        time.sleep(0.05)
        price = PRICES.get(item_id)
        if price is None:
            # Warning level; can be color-coded / filtered as level=warn in the dashboard.
            logfire.warn("unknown item {item_id}, using default price", item_id=item_id)
            price = 500
        return price


def save_order(order: Order, total: int) -> None:
    with logfire.span("save order to db"):
        time.sleep(0.03)
        logfire.debug(
            "persisted order", item_id=order.item_id, qty=order.qty, total=total
        )


@app.post("/orders")
def create_order(order: Order):
    # Receiving a Pydantic model records the validated request body as attributes automatically.
    with logfire.span("create order for item {item_id}", item_id=order.item_id):
        price = fetch_price(order.item_id)  # child span (~50ms)
        total = price * order.qty
        save_order(order, total)  # child span (~30ms)
        logfire.info(
            "order created: {total} yen (item {item_id} x{qty})",
            total=total,
            item_id=order.item_id,
            qty=order.qty,
        )
    return {"item_id": order.item_id, "qty": order.qty, "total": total}


@app.get("/levels")
def log_levels():
    # Demo of the log levels; the dashboard color-codes and lets you filter by level.
    logfire.debug("this is a debug log")
    logfire.info("this is an info log")
    logfire.warn("this is a warning log")
    logfire.error("this is an error log")
    return {"message": "emitted logs at debug/info/warn/error"}


@app.get("/boom")
def boom():
    # Raise an exception to see Logfire record the exception and its stack trace on the span.
    with logfire.span("risky operation"):
        data = {"a": 1}
        return {"value": data["b"]}  # KeyError -> 500, exception recorded on the span
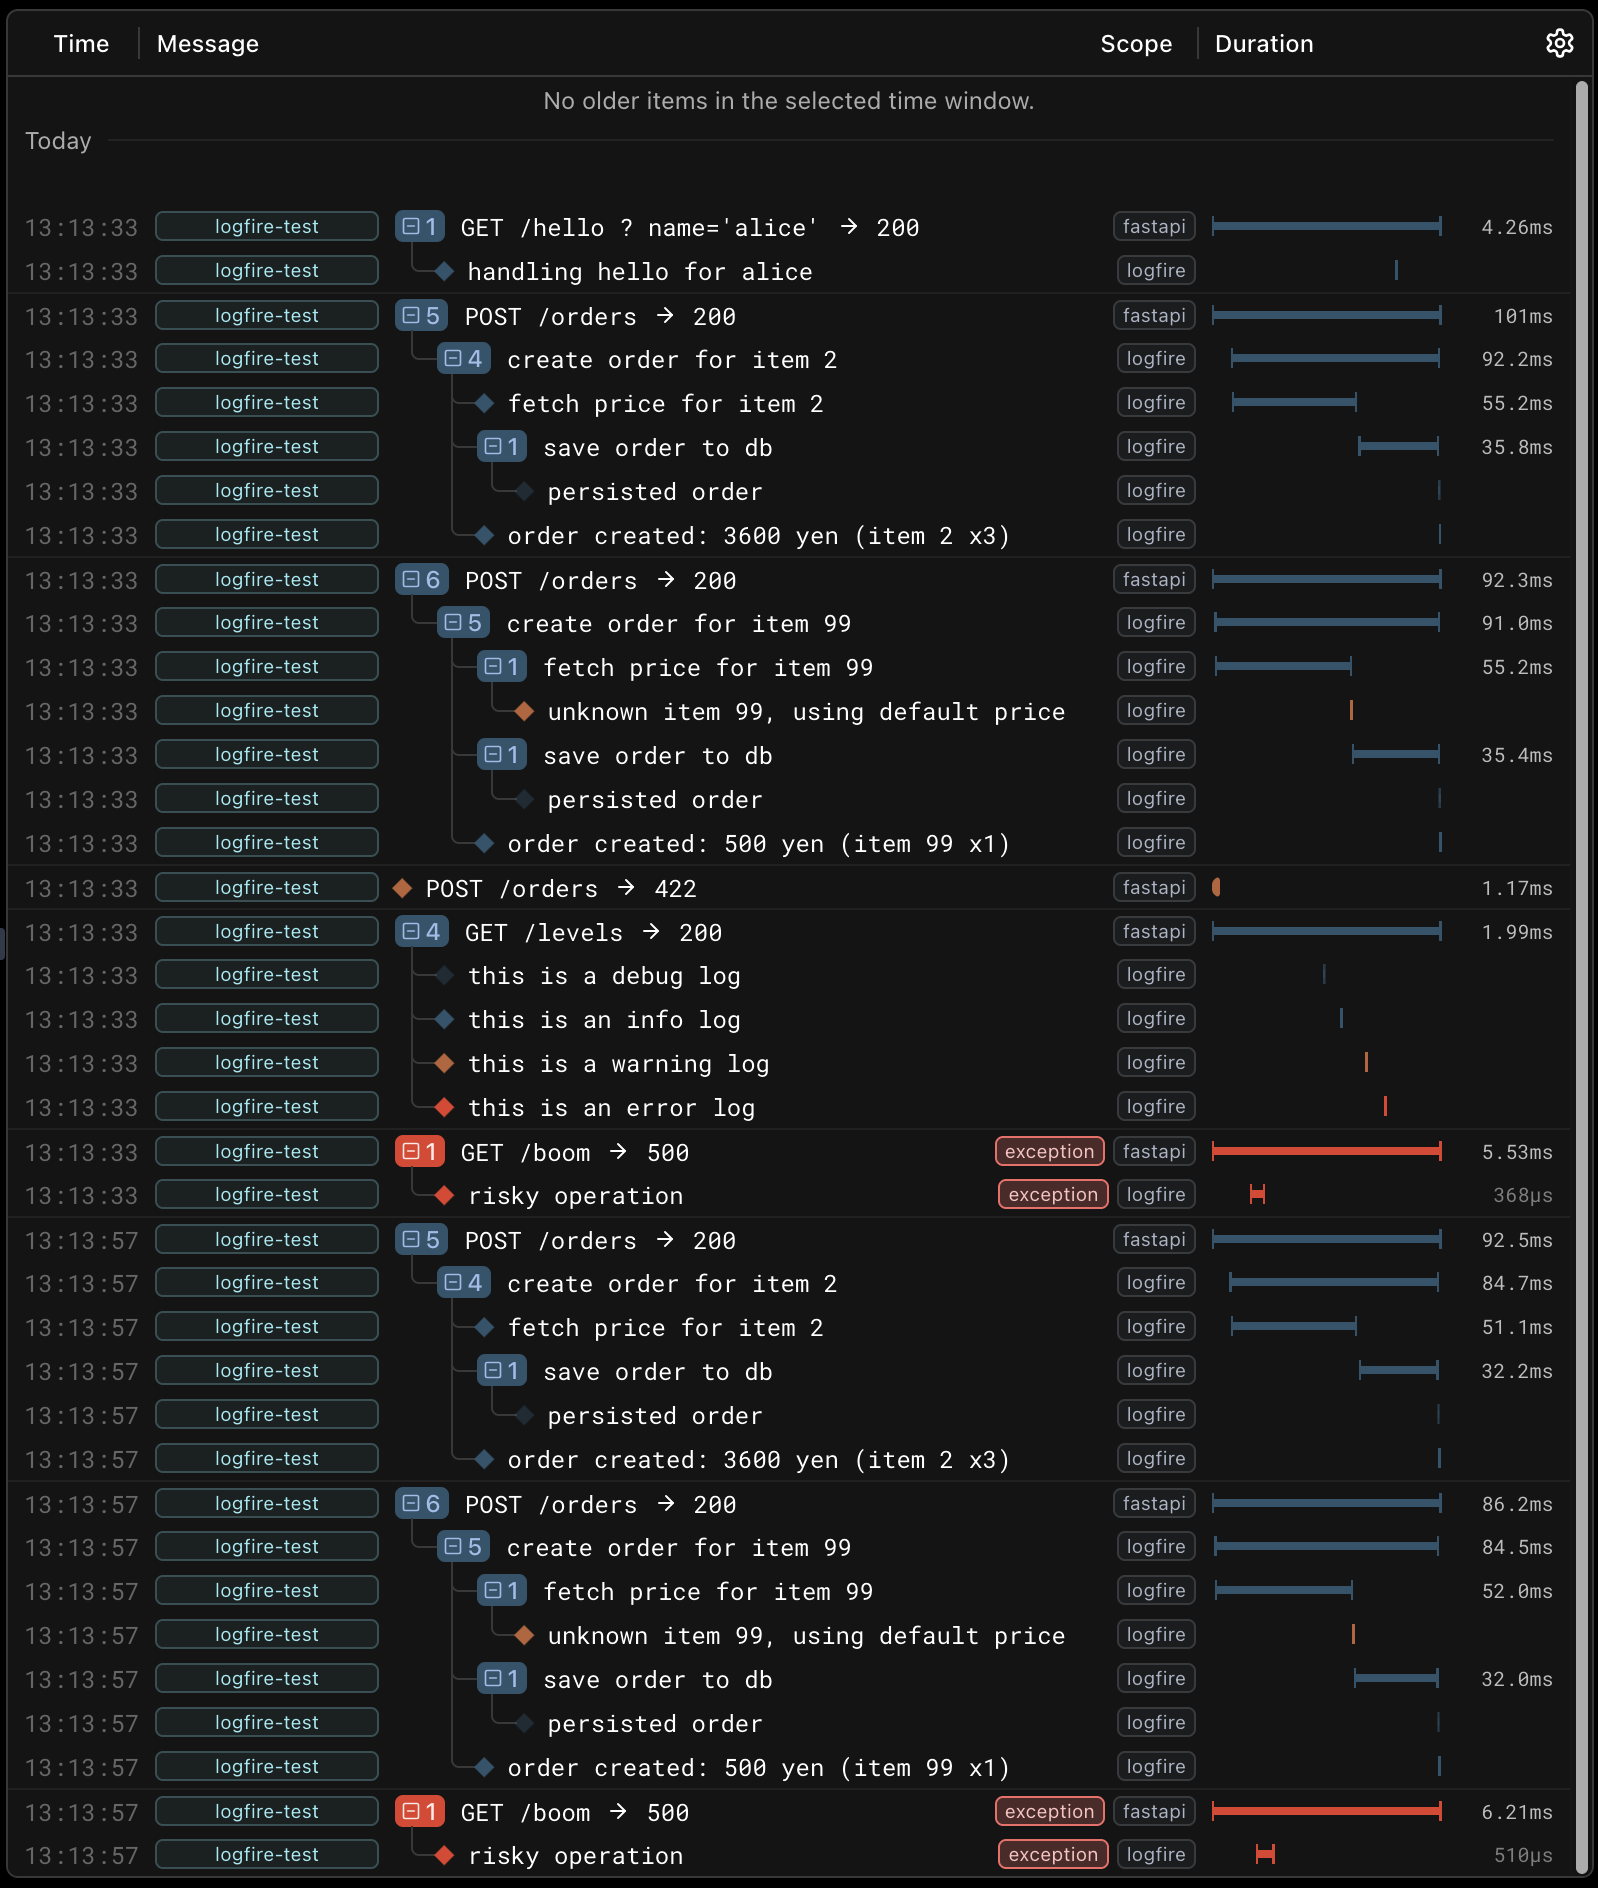
さっきの main.py を拡張して、手動 span・ログレベル・例外・Pydantic ボディを盛り込んだ。 logfire.span(...) で自分のコードにも span を張れるし、 logfire.debug/info/warn/error でレベル付きのログを出せる。 /orders・/levels・/boom をひととおり叩いてダッシュボードを開くと、こんな画面になる。
service_name でサービスを見分ける
configure() に service_name="logfire-test" を渡したので、各行の左端のバッジが全部 logfire-test になった。前のスクリーンショットで unknown_service になってたのは、これを指定してなかったから。サービスが増えても、この列でどのサービスのログかを見分けられる。
色でログレベルが一目で分かる
GET /levels の行を見ると、ログレベルが色分けされてる。 debug・info は青、 warning はオレンジ、 error は赤の菱形。ずらっと流れる中でも赤やオレンジだけ目で拾える。 fetch price の中に埋もれてる unknown item 99, using default price(オレンジ=warn)も、色ですぐ見つかる。
ウォーターフォールで順番と所要時間が見える
いちばん効くのがこれ。 POST /orders(101ms)を展開すると、中で走った span が入れ子で並ぶ。
POST /orders → 200                101ms
└─ create order for item 2         92ms
   ├─ fetch price for item 2       55ms
   └─ save order to db             35ms
バーの位置が実行の順番を、長さが所要時間を表す。 fetch price のバーは左寄り(先に実行)、 save order のバーは右にずれてる(fetch price のあと)。子の 55ms + 35ms ≒ 90ms で、親の create order(92ms)とほぼ一致する。実際のアプリなら「全体のうちこの SQL が 8 割」みたいなボトルネックの特定が、この見た目だけでできる。
エラーは赤と exception バッジで即発見
GET /boom → 500 は行そのものが赤くて、 exception タグが付く。親の fastapi span と子の risky operation span の両方に付くので、どの span で例外が出たかまで辿れる。
422 と 500 で木の形が違う
同じ失敗でも、トレースの形が違う。 POST /orders → 422(バリデーション失敗)には子 span が無い。 FastAPI が本体に入る前に弾いたから。一方 /boom → 500 には risky operation の子がある。つまり自分のコードの中で落ちてる。失敗がリクエストのどの段階で起きたかが、木の形からわかる。
FastAPI Cloud との連携
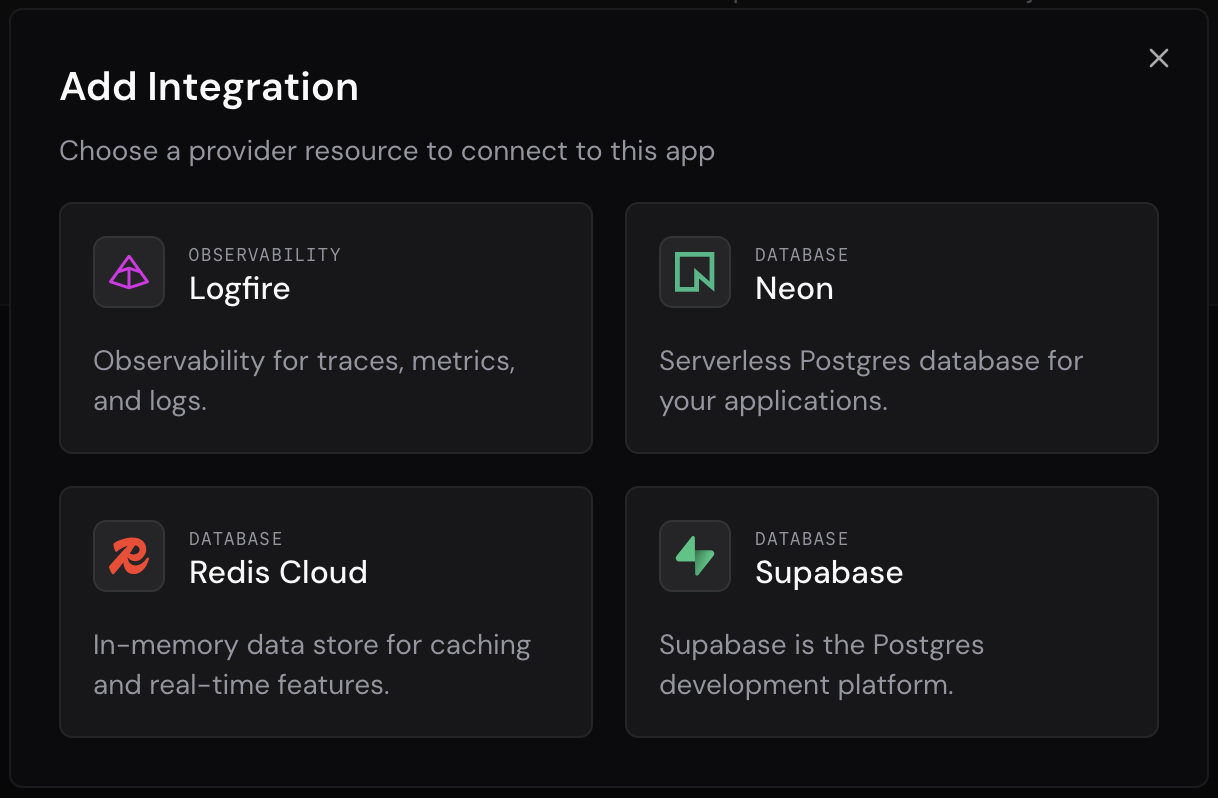
FastAPI Cloud との連携もできる: cf. Logfire と連携する - FastAPI Cloud
下の画像は FastAPI Cloud ダッシュボード > Apps > 該当アプリの詳細画面 > Integrations > Connect Integration の画面。