グラフ表示(plotly)
plotly を使って、 Web アプリケーションの機能としてインタラクティブなグラフ表示を実装する。
- インストール: cf. 公式ドキュメント
グラフの元データ
グラフの元になるデータは xy.txt と xy_negative.txt の 2 つ。 1 行目に x_value y_value というヘッダーがあって、 2 行目以降がスペース区切りの数値。
xy.txt
x_value y_value
1.0 10.5
2.0 15.3
3.0 20.1
4.0 18.7
5.0 22.0
6.0 25.4
7.0 30.2
8.0 28.8
9.0 35.0
10.0 40.5
11.0 38.2
12.0 42.1
13.0 45.3
14.0 50.0
15.0 48.7
16.0 55.2
17.0 60.1
18.0 58.4
19.0 62.7
20.0 70.0
21.0 65.8
22.0 72.3
23.0 68.7
24.0 75.2
25.0 80.1
26.0 78.4
27.0 85.0
28.0 90.3
29.0 88.7
30.0 95.2
31.0 100.1
32.0 98.4
33.0 105.0
34.0 110.5
35.0 108.2
36.0 115.3
37.0 120.0
38.0 118.7
39.0 125.4
40.0 130.2
41.0 128.8
42.0 135.0
43.0 140.5
44.0 138.2
45.0 145.3
46.0 150.0
47.0 148.7
48.0 155.2
49.0 160.1
50.0 158.4
51.0 165.0
52.0 170.3
53.0 168.7
54.0 175.2
55.0 180.1
56.0 178.4
57.0 185.0
58.0 190.3
59.0 188.7
60.0 195.2
61.0 200.1
62.0 198.4
63.0 205.0
64.0 210.5
65.0 208.2
66.0 215.3
67.0 220.0
68.0 218.7
69.0 225.4
70.0 230.2
71.0 228.8
72.0 235.0
73.0 240.5
74.0 238.2
75.0 245.3
76.0 250.0
77.0 248.7
78.0 255.2
79.0 260.1
80.0 258.4
81.0 265.0
82.0 270.3
83.0 268.7
84.0 275.2
85.0 280.1
86.0 278.4
87.0 285.0
88.0 290.3
89.0 288.7
90.0 295.2
91.0 300.1
92.0 298.4
93.0 305.0
94.0 310.5
95.0 308.2
96.0 315.3
97.0 320.0
98.0 318.7
99.0 325.4
100.0 330.2
xy_negative.txt
x_value y_value
-10.0 12.0
-9.8 11.6
-9.6 11.2
-9.4 10.8
-9.2 10.4
-9.0 10.0
-8.8 9.6
-8.6 9.2
-8.4 8.8
-8.2 8.4
-8.0 8.0
-7.8 7.6
-7.6 7.2
-7.4 6.8
-7.2 6.4
-7.0 6.0
-6.8 5.6
-6.6 5.2
-6.4 4.8
-6.2 4.4
-6.0 4.0
-5.8 3.6
-5.6 3.2
-5.4 2.8
-5.2 2.4
-5.0 2.0
-4.8 1.6
-4.6 1.2
-4.4 0.8
-4.2 0.4
-4.0 0.0
-3.8 -0.4
-3.6 -0.8
-3.4 -1.2
-3.2 -1.6
-3.0 -2.0
-2.8 -2.4
-2.6 -2.8
-2.4 -3.2
-2.2 -3.6
-2.0 -4.0
-1.8 -4.4
-1.6 -4.8
-1.4 -5.2
-1.2 -5.6
-1.0 -6.0
-0.8 -6.4
-0.6 -6.8
-0.4 -7.2
-0.2 -7.6
0.0 -8.0
0.2 -8.4
0.4 -8.8
0.6 -9.2
0.8 -9.6
1.0 -10.0
1.2 -10.4
1.4 -10.8
1.6 -11.2
1.8 -11.6
2.0 -12.0
2.2 -12.4
2.4 -12.8
2.6 -13.2
2.8 -13.6
3.0 -14.0
3.2 -14.4
3.4 -14.8
3.6 -15.2
3.8 -15.6
4.0 -16.0
4.2 -16.4
4.4 -16.8
4.6 -17.2
4.8 -17.6
5.0 -18.0
5.2 -18.4
5.4 -18.8
5.6 -19.2
5.8 -19.6
6.0 -20.0
6.2 -20.4
6.4 -20.8
6.6 -21.2
6.8 -21.6
7.0 -22.0
7.2 -22.4
7.4 -22.8
7.6 -23.2
7.8 -23.6
8.0 -24.0
8.2 -24.4
8.4 -24.8
8.6 -25.2
8.8 -25.6
9.0 -26.0
9.2 -26.4
9.4 -26.8
9.6 -27.2
9.8 -27.6
10.0 -28.0
エンドポイントの構成
エンドポイントは 2 つ。
/— グラフ用データファイルを選択して、/graphへ POST する/graph— 受け取ったデータから、インタラクティブなグラフを表示する
plotly の API
このアプリで使ってる plotly の API は下記の通り。
plotly.graph_objects.Figure— 描画用オブジェクトfigを作る。Figure.add_trace— グラフ用のデータをfigに追加する。plotly.graph_objects.Scatter— グラフ用のデータを指定する。Figure.update_layout— タイトルや軸名の設定、 Y 軸をリニアと対数で切り替えるボタンの追加など。Figure.to_html— 描画用オブジェクトfigを HTML 化する。
コード
main.py
from fastapi import FastAPI, Query, Form
from fastapi.responses import HTMLResponse
from fastapi.templating import Jinja2Templates
from starlette.requests import Request
import plotly.graph_objects as go

app = FastAPI()

templates = Jinja2Templates(directory="templates")


# xy.txt, xy_negative.txt のデータを読み込む関数; ファイル名(or ファイルパス)をリストに入れて渡す
def read_xy_data(file_path):
    x, y = [], []
    try:
        with open(file_path, "r") as file:
            for line in file:
                try:
                    x_val, y_val = map(float, line.split())
                    x.append(x_val)
                    y.append(y_val)
                except ValueError:
                    # 数値以外のデータは無視; ファイルの1行目にある、x_value y_valueっていう文字列を無視できる
                    continue
    except FileNotFoundError:
        print(f"File not found: {file_path}")
    return x, y


@app.get("/", response_class=HTMLResponse)
async def home(request: Request):
    return templates.TemplateResponse("index.html", {"request": request})


@app.post("/graph", response_class=HTMLResponse)
async def graph(request: Request, files: list[str] = Form(...)):
    fig = go.Figure()

    # 指定されたファイルを順番に処理
    for file in files:
        x, y = read_xy_data(file)

        if not x or not y:
            return templates.TemplateResponse(
                "error.html",
                {
                    "request": request,
                    "file": file,  # ← error.htmlでファイル名を表示するために渡してるだけ
                },
                status_code=500,
            )

        # データをグラフに追加
        fig.add_trace(go.Scatter(x=x, y=y, mode='lines+markers', name=f'{file}'))

    # レイアウト設定
    fig.update_layout(
        title="Example: Title",
        xaxis_title="Example: X-axis",
        yaxis_title="Example: Y-axis",
        template="plotly_white",
        showlegend=True,  # これがないと1つのファイルを選択したときに凡例が表示されなくなる
        updatemenus=[  # Y軸をリニアと対数で切り替えるためのボタン
            {
                'buttons': [
                    {
                        'args': [{'yaxis.type': 'linear'}],  # 辞書で指定するのではなくて"."を使って書けばこの要素だけオーバーライドできる(relayout)
                        'label': 'y: Linear Scale',
                        'method': 'relayout'
                    },
                    {
                        'args': [{'yaxis.type': 'log'}],  # 辞書で指定するのではなくて"."を使って書けばこの要素だけオーバーライドできる(relayout)
                        'label': 'y: Logarithmic Scale',
                        'method': 'relayout'
                    }
                ],
                'direction': 'down',
                'pad': {'r': 10, 't': 10},
                'showactive': True,
                'x': 0.17,
                'xanchor': 'left',
                'y': 1.15,
                'yanchor': 'top'
            }
        ]
    )

    # グラフをHTML化
    graph_html = fig.to_html()

    return HTMLResponse(content=graph_html, status_code=200)
index.html
<!DOCTYPE html>
<html lang="en">
<head>
    <meta charset="UTF-8">
    <meta name="viewport" content="width=device-width, initial-scale=1.0">
    <title>Select Data Files</title>
</head>
<body>
    <h1>Select Data Files</h1>
    <form action="/graph" method="post" target="_blank">
        <label for="xy_txt">xy.txt</label>
        <input type="checkbox" name="files" value="xy.txt" id="xy_txt">
        <br>
        <label for="xy_negative_txt">xy_negative.txt</label>
        <input type="checkbox" name="files" value="xy_negative.txt" id="xy_negative_txt">
        <br><br>
        <button type="submit">See Graphs</button>
    </form>
</body>
</html>
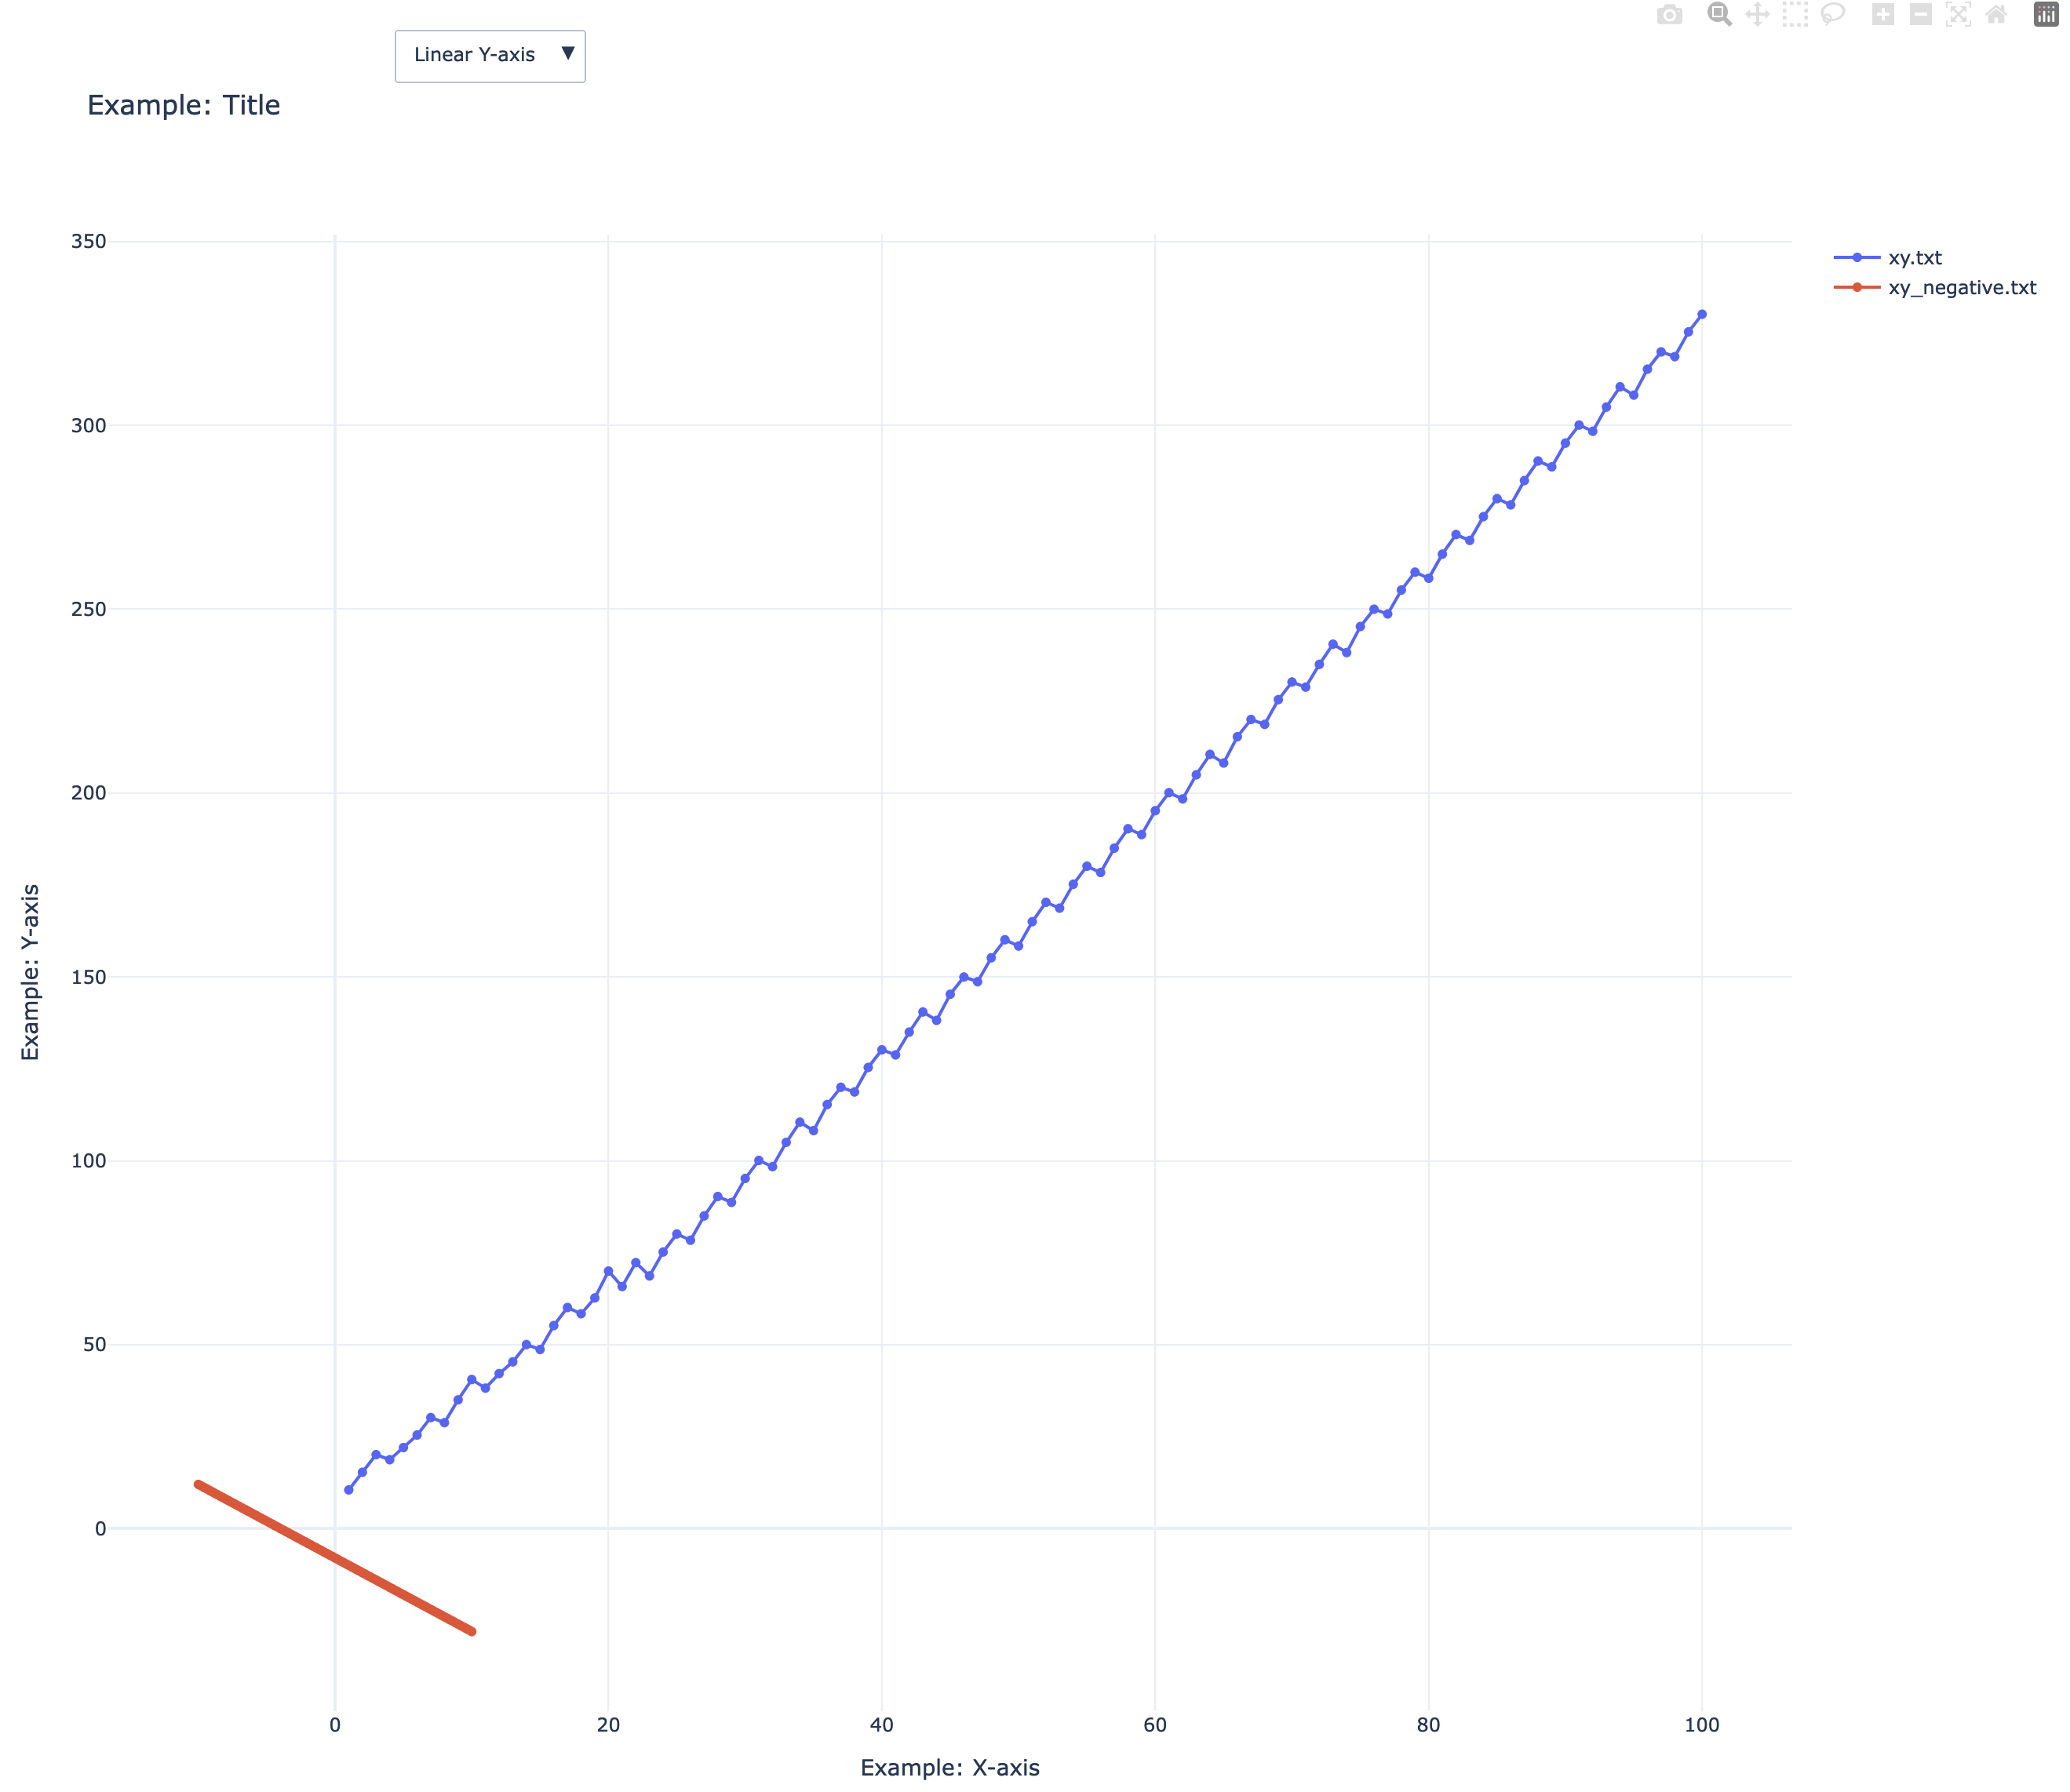
表示されるグラフ
拡大縮小も Y 軸の切り替え( Linear / Log )もできるし、凡例の部分を押すと、そのグラフの表示 / 非表示も切り替えられる。
軸目盛の調整
exponentformat で「 10 の何乗」みたいな指数表記を調整できる。